

Key Takeaways
- Source over Habit: The closer a change is to the energy source (like power generation), the larger the impact. Changing where your energy comes from is a bigger lever than changing small daily habits.
- The 40/30 Rule: For most households, Home Energy (~40%) and Transportation (~30%) are the two largest “fingers” of the carbon footprint because they sit closest to the source.
- Visibility vs. Impact: High-visibility actions like recycling often have the smallest relative footprint impact (~2%), while less visible factors like your home’s heating source or the local grid mix carry the most weight.
- Understanding, Not Judgment: A carbon footprint is a tool for tracing energy flows, not a moral scorecard. Understanding proportions helps you focus on what actually moves the needle.
Quick answer: A carbon footprint isn’t really about global abstractions or personal virtue — it comes down to where your energy comes from. This page reframes the idea in plain terms, introduces the Carbon Fingers framework, and shows why getting closer to the source changes the outcome more than small daily habits do.
Why “Carbon Footprint” Feels So Confusing
The phrase gets used so often that it starts to lose meaning. Global emissions charts. Lifestyle checklists telling you to skip straws or unplug toasters. A vague sense that the whole thing is bigger than any one household could possibly affect. None of that actually explains anything — it just adds noise on top of a concept that’s simpler than it sounds.
It’s Not a Moral Scorecard
A carbon footprint isn’t a grade on how good or careful someone is. It’s a way of tracing where the energy behind daily life actually comes from — nothing more, nothing less.
The Real Question Is About Source, Not Habit
Most footprint conversations focus on small daily actions. The bigger factor, most of the time, is where the energy powering those actions came from in the first place.
This Builds on How Electricity Gets Generated
Once electricity generation and the grid make sense, this next step is easier to follow: the mix of sources behind your electricity connects directly to your household’s footprint.
The Closer to the Source, the Bigger the Change
Here’s the idea at the center of this whole page: the closer a change gets to the source of energy, the more it moves the outcome. That single idea reorganizes how the rest of the topic feels.
Some Changes Sit Close to the Source
Changing where your power comes from, or how you get around, sits close to the source. These are the direct levers — the ones that tend to move a footprint the most, because they reach the energy itself.
Some Changes Sit Further Downstream
Cutting back on food waste, or buying less, sits further from the source. These still matter, and they’re indirect by comparison — smaller movements, further down the chain.
Why This Reframes Everything
Two households with identical daily habits can have very different footprints simply because of where their electricity comes from. That’s the whole point: the source is the lever that moves the most. Change the source, and the math reorganizes.
Introducing Carbon Fingers
Instead of an overwhelming list of categories, this page uses a simple framework called Carbon Fingers — five main areas that shape a household’s footprint. Think of them as five fingers on a hand: distinct, but part of the same whole.
The Five Areas
Home Energy, Transportation, Food, Goods and Shopping, and Recycling make up the five Carbon Fingers. Together, they cover the areas most likely to shape a household’s overall footprint.
Roughly How the Five Areas Break Down
| Category | Rough Share | What It Covers |
| Home Energy | ~40% | Electricity for lighting, cooling, appliances, and electronics, plus heating and hot water from gas, oil, or other fuels |
| Transportation | ~30% | Getting around day to day — mostly driving personal vehicles, including trips for shopping, food, and errands |
| Food | ~15% | Producing, processing, and transporting food, plus the share lost to food waste |
| Goods & Shopping | ~13% | Making and shipping everyday purchases — clothing, electronics, and other consumer products |
| Recycling | ~2% | The modest reduction from reusing materials like bottles, aluminum, and cardboard |
These shares are rough context, not exact figures. They’re here to show the relative size of each area — actual results vary by location, household, and how the footprint is calculated.
The Point Is Proportion, Not Precision
Carbon Fingers isn’t meant to function as a precise personal audit. It’s meant to show, at a glance, where the biggest levers tend to sit — so the conversation has structure instead of sprawl.
Home Energy: Usually the Biggest Piece
Look at the rough breakdown, and one area stands out: home energy tends to be the largest single piece for most households. That’s not a coincidence — and it sits closest to the source, which is exactly why it’s the biggest lever.
This Is Where Generation and Footprint Meet
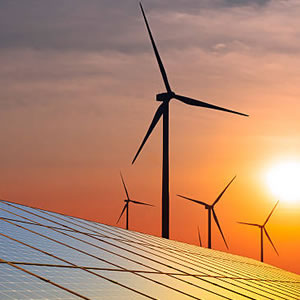
The generation mix behind your electricity — gas, hydro, nuclear, wind, solar — directly shapes how much this piece of the footprint weighs. Change the source, and the math reorganizes. A cleaner generation mix means a lighter footprint, without a single daily habit having to change.
Heating Adds Another Layer
For homes that heat with fuel oil, propane, or natural gas directly, heating adds its own footprint on top of electricity use — a separate stream worth understanding on its own.
This Category Rewards Understanding the System
Because home energy connects so directly to generation and the grid, understanding how electricity moves through that system makes this category click almost immediately.
Transportation, Food, and Everyday Goods
The remaining Carbon Fingers — transportation, food, and goods and shopping — round out the picture. Each works differently, and each sits at a different distance from the source.
Transportation Sits Close to the Source
Gasoline vehicles connect to combustion directly. Electric vehicles connect back to the same generation mix — which means their footprint shifts depending on what’s powering the grid. Either way, how you get around sits near the source, which is why it’s a meaningful lever.
Food Carries Hidden Energy
Growing, processing, and transporting food all use energy long before it reaches a plate. A good chunk of food’s share comes from something easy to overlook: waste. Food that gets bought and thrown away still carries all the energy it took to produce and move it. This area sits further downstream — it matters, just less than the source itself.
Goods and Shopping Sit Downstream Too
Everyday purchases carry embedded energy from manufacturing and shipping. This area tends to be smaller, and it sits further from the source — a real part of the picture, and an indirect lever compared to power and transportation.
Recycling’s Real Role
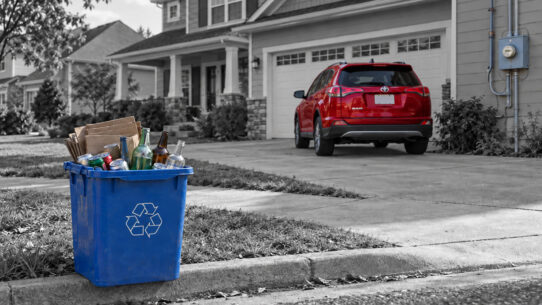
Recycling gets more attention in everyday footprint conversations than almost any other area — and it’s worth naming clearly: it tends to carry the smallest weight of the five Carbon Fingers, and it sits furthest from the source.
Recycling Still Matters, Just Not the Way People Assume
This isn’t a case against recycling. It plays a role in waste and material reuse. It simply isn’t the largest lever in a household’s carbon footprint, even though it often gets treated that way.
Attention and Impact Don’t Always Match
Recycling’s visibility — bins, sorting, weekly pickup — makes it feel central. Home energy and transportation are far less visible day to day, which is part of why the areas closest to the source are the easiest to underestimate.
Why This Isn’t a Scorecard
None of this is meant to add pressure or produce a grade. The point of Carbon Fingers is understanding, not judgment — seeing where a footprint actually comes from, so the picture feels grounded instead of abstract.
Understanding Comes Before Any Decision
Nothing here asks for a change in behavior. It simply lays out where the pieces sit, and which ones sit closest to the source.
This Connects to Air Quality Too
Home energy’s link to generation also connects to something else: air quality — a closely related piece of the picture.
Frequently Asked Questions
What is a carbon footprint, in plain terms? It’s a way of tracing how much energy use — and what kind of energy — stands behind daily life, from home energy to transportation to food.
What is the Carbon Fingers framework? A simple way of organizing a household’s footprint into five areas: Home Energy, Transportation, Food, Goods and Shopping, and Recycling — and seeing which sit closest to the source of energy.
Why does getting closer to the source matter more? Because the source is the biggest lever. Changing where power comes from, or how you get around, moves a footprint more than downstream changes like buying or wasting less.
Is home energy really the biggest factor for most households? For most households, yes — home energy is usually the largest of the five Carbon Fingers areas, largely because of how much it’s used daily and how close it sits to the source.
Do the percentages have to be exact? No. They’re rough context to show the relative size of each area, not precise figures — actual results vary by household and location.
Do electric vehicles have a footprint too? Yes — their footprint depends on what’s powering the electricity grid where they’re charged, which ties them back to the source.
Is this framework meant to make people feel guilty about their footprint? No. It’s built for understanding, not judgment — there’s no scorecard, grade, or pressure attached to it.
How does this connect to electricity generation? Directly — home energy, the area closest to the source and the largest for most households, traces straight back to how electricity gets generated and delivered.

Author: Frank Rosa
After decades in energy and sustainability, Frank founded Clean Energy Local to make electricity easier to understand—connecting how power is made with the grid, air quality, health, and everyday carbon footprint.